
Team Overview: Staff Coverage by Hour
The Coverage tab of the Team Overview page shows your staffing level for every hour of the day: how many employees are typically working at 9:00, at 14:00, at 22:00. If you run customer support, a help desk, or a team spread across time zones, this is the fastest way to see coverage gaps and plan shifts.
The Staff per hour chart has one bar per hour of the day, in your timezone. The bar height is the average number of employees tracking during that hour per day, computed over the last 7 complete days — today, still in progress, is not part of this tab at all. Hover any bar to see the peak day (the most people ever simultaneously in that hour), the total hours tracked in that slot, and which projects cover this hour — a per-project split of who is actually working then.
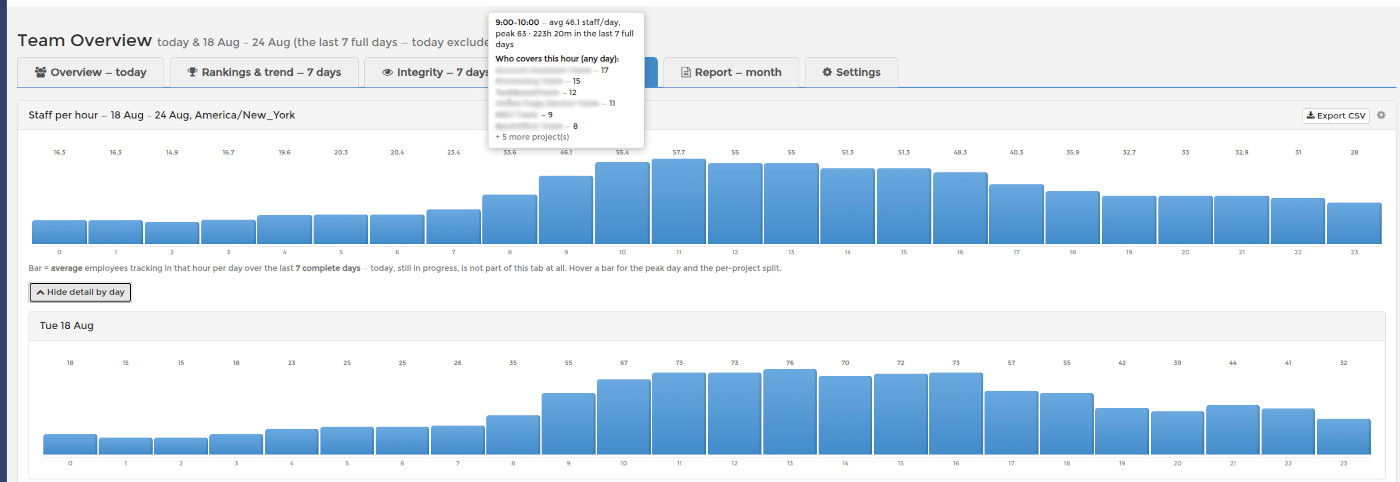
Below the overall chart, a per-day detail view breaks the same picture into seven mini-charts, one per calendar day, all on a shared scale so days stay visually comparable. That is where you distinguish "we always have two people at 8:00" from "we had four on Monday and nobody the rest of the week".
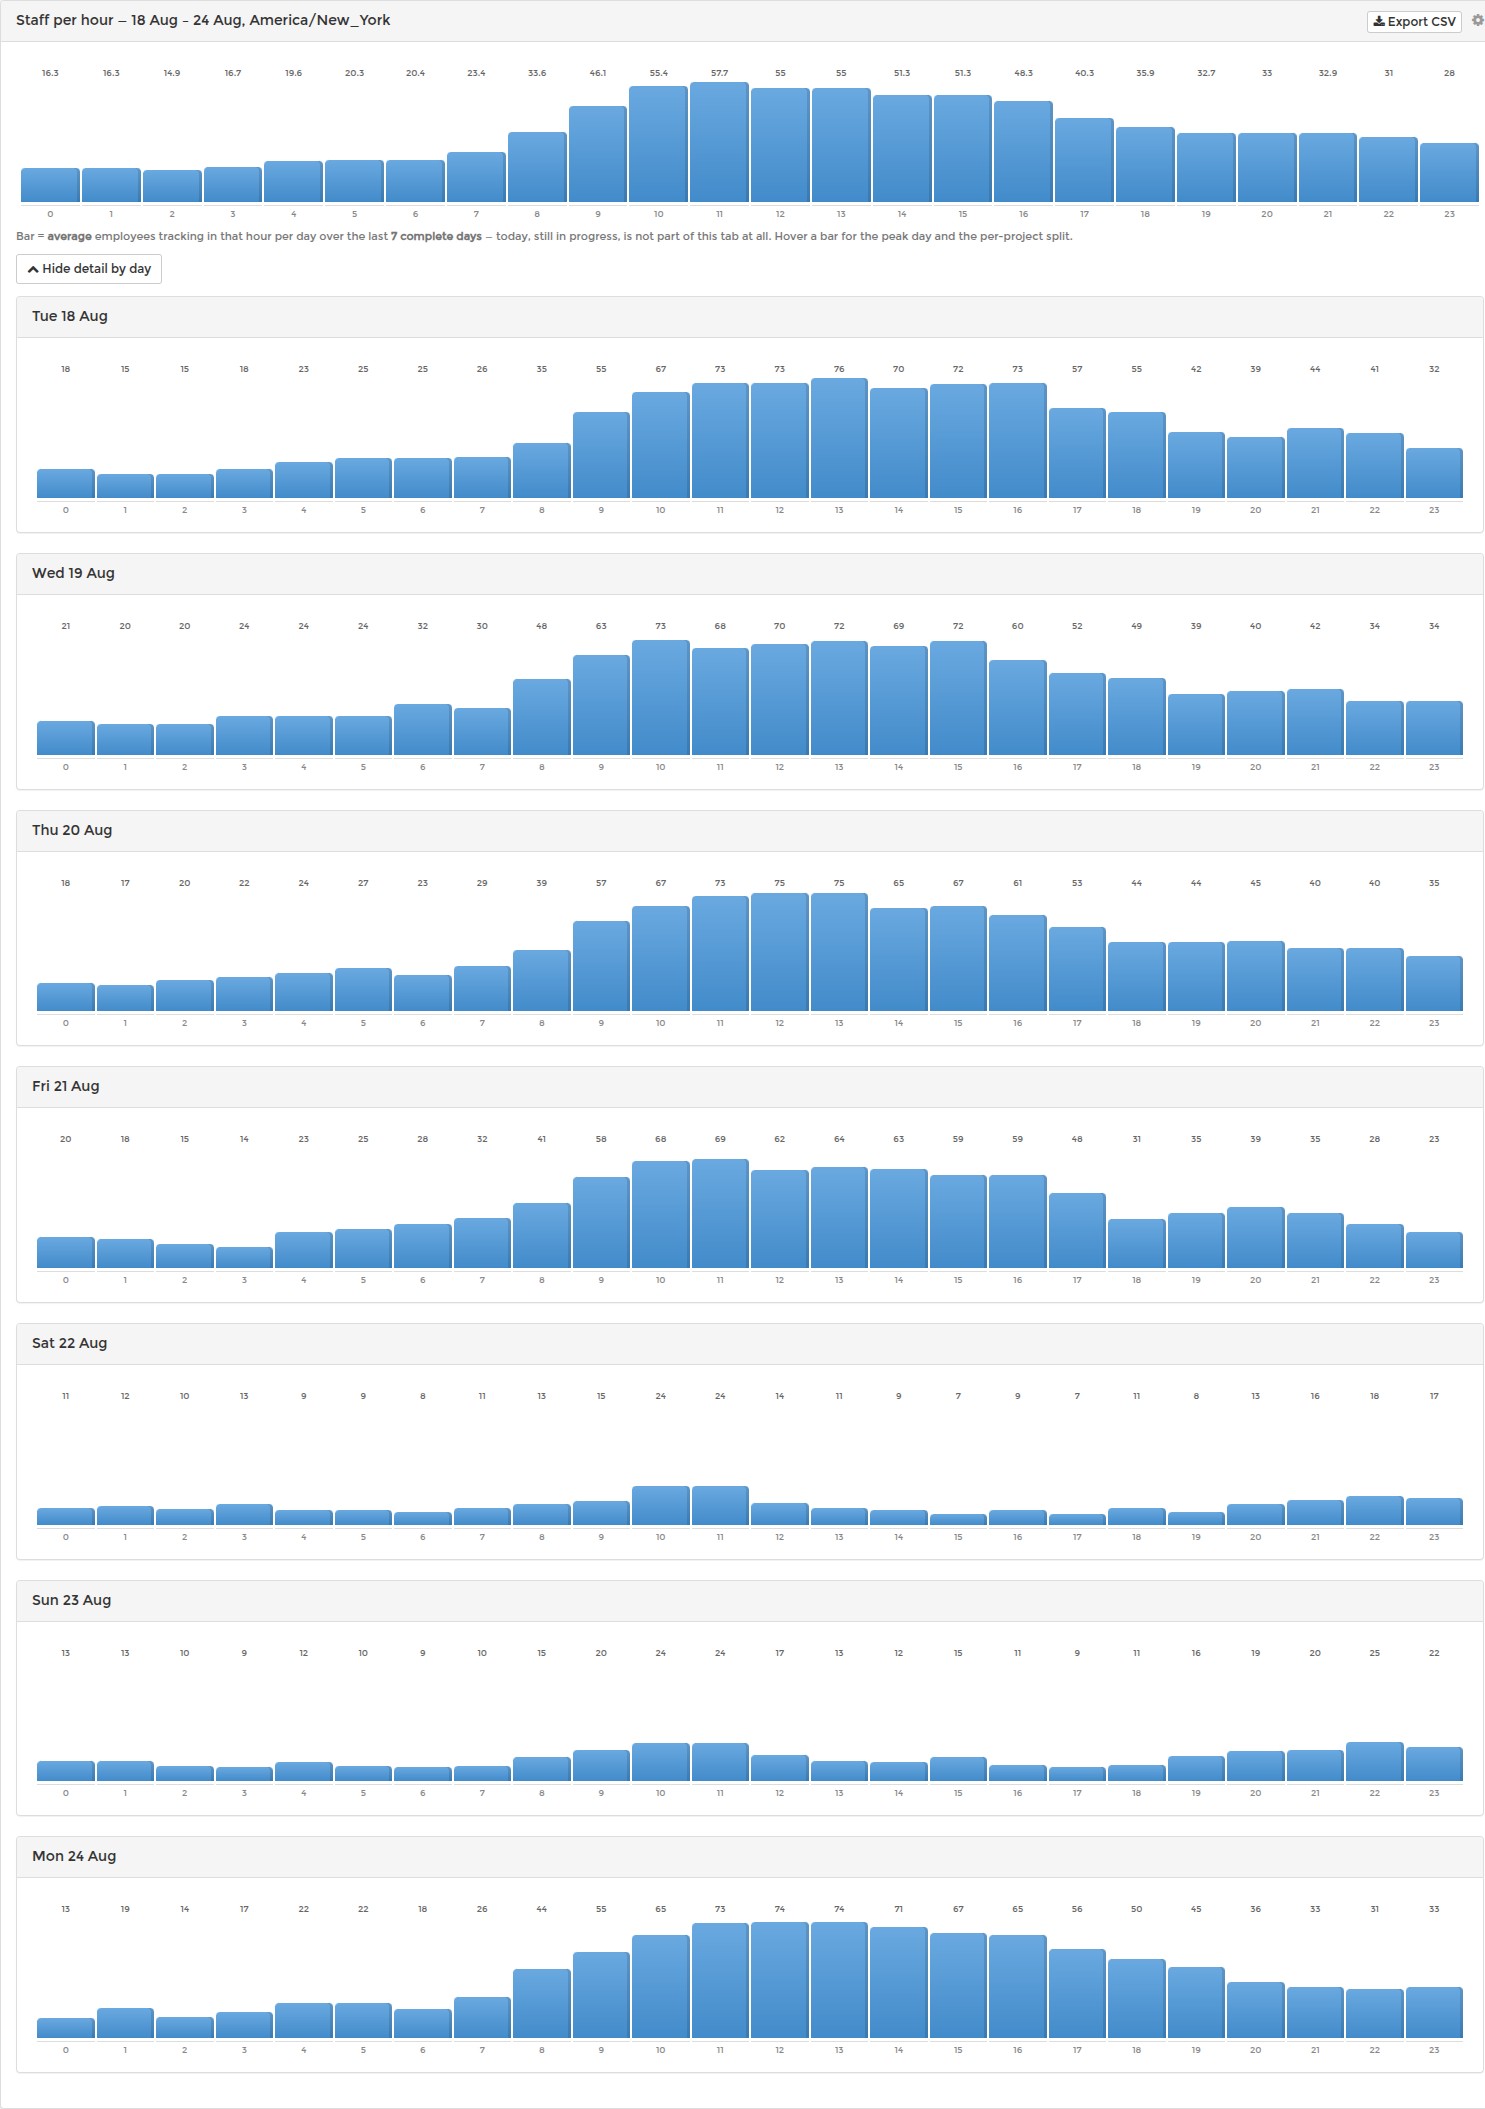
Typical uses: finding hours where nobody covers support, checking the overlap window of a distributed team, verifying that agreed shift patterns actually happen, and spotting employees consistently working late nights. The chart exports to CSV for further analysis.